
Infographic Guide to Standout Plots
See the hidden mechanics your genre's bestsellers use
The books readers finish, recommend, and cancel plans to finish all have something in common. These diagrams show you what, in a single page.
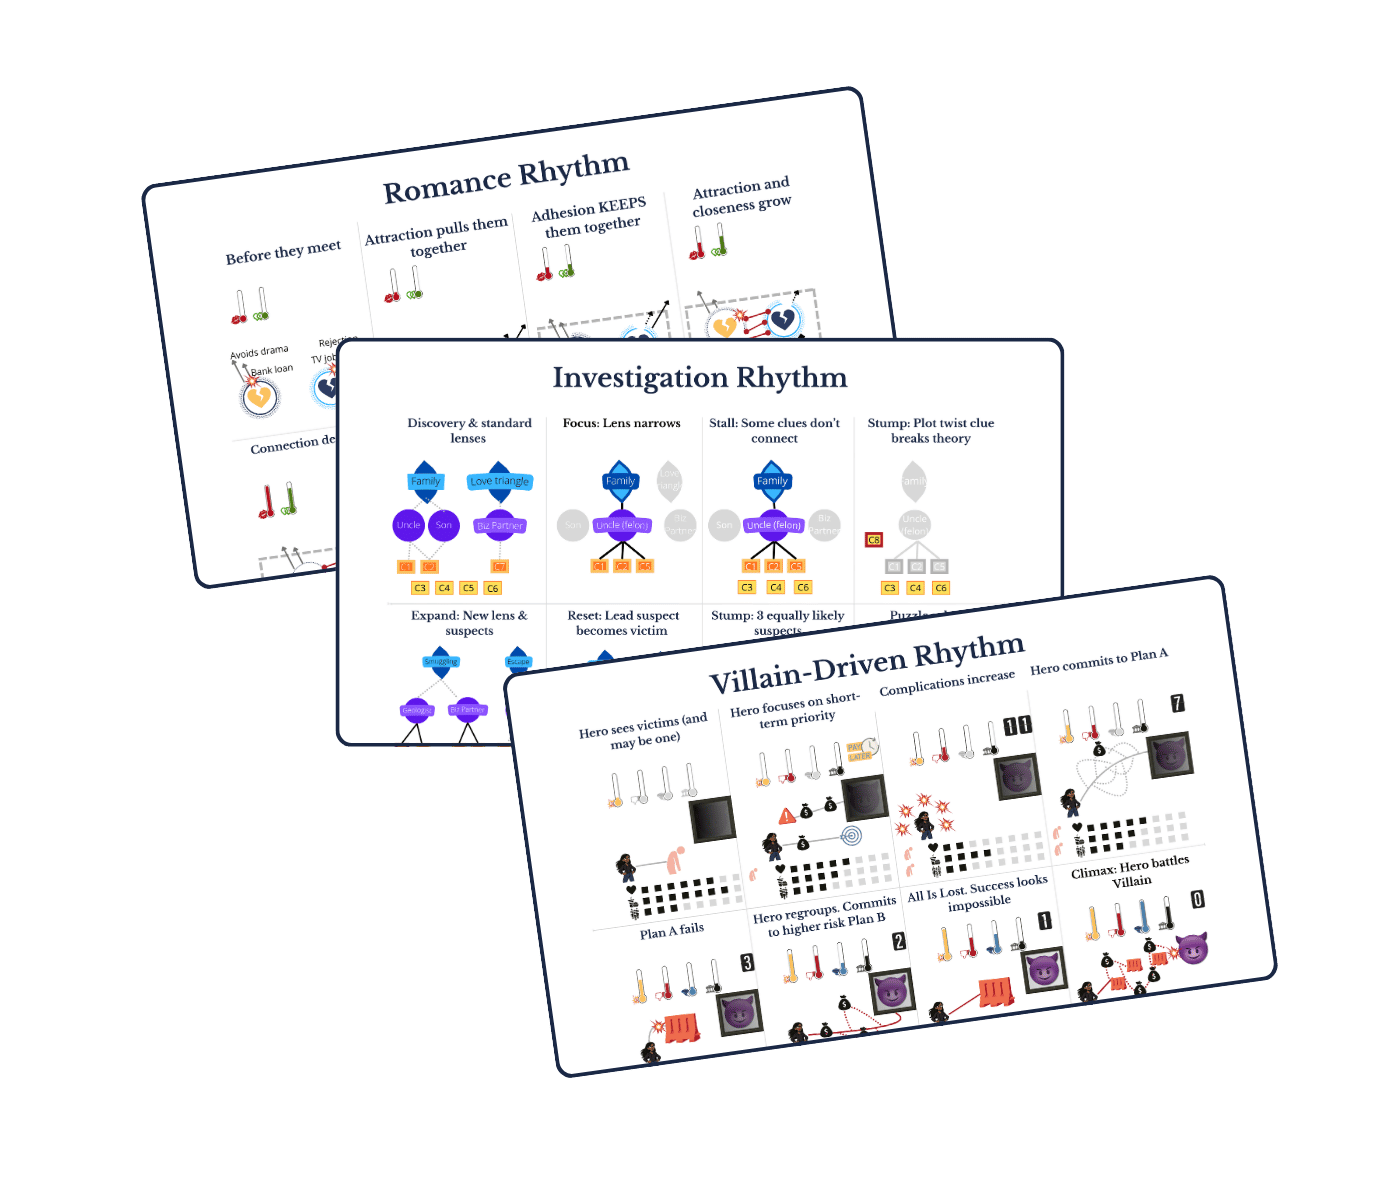
Three one page infographics. One per plot type.
💥Villain-driven plots. See the invisible levers bestsellers like The Hunger Games, The Martian, and the Jack Reacher novels use to keep pressure accumulating and readers breathless.
🔍Mystery plots. Discover how the best mysteries make the investigation feel like it's constantly changing shape, keeping readers guessing until the very end.
💕Romance Plots. Uncover the invisible dynamics that reader-favorite romances use to keep heroes off-kilter and growing closer, and that make readers desperate for the HEA and worried it'll never come.
These aren't beat sheets.
Beat sheets tell you what event should happen. These diagrams show everything happening at once, on a single page, so the mechanics that text-based craft advice describes across chapters are visible in one glance.